In your dashboards and reports, new reporting options are available for LinkedIn posts.
Analyze the success of your posts on LinkedIn with LinkedIn Post Performance
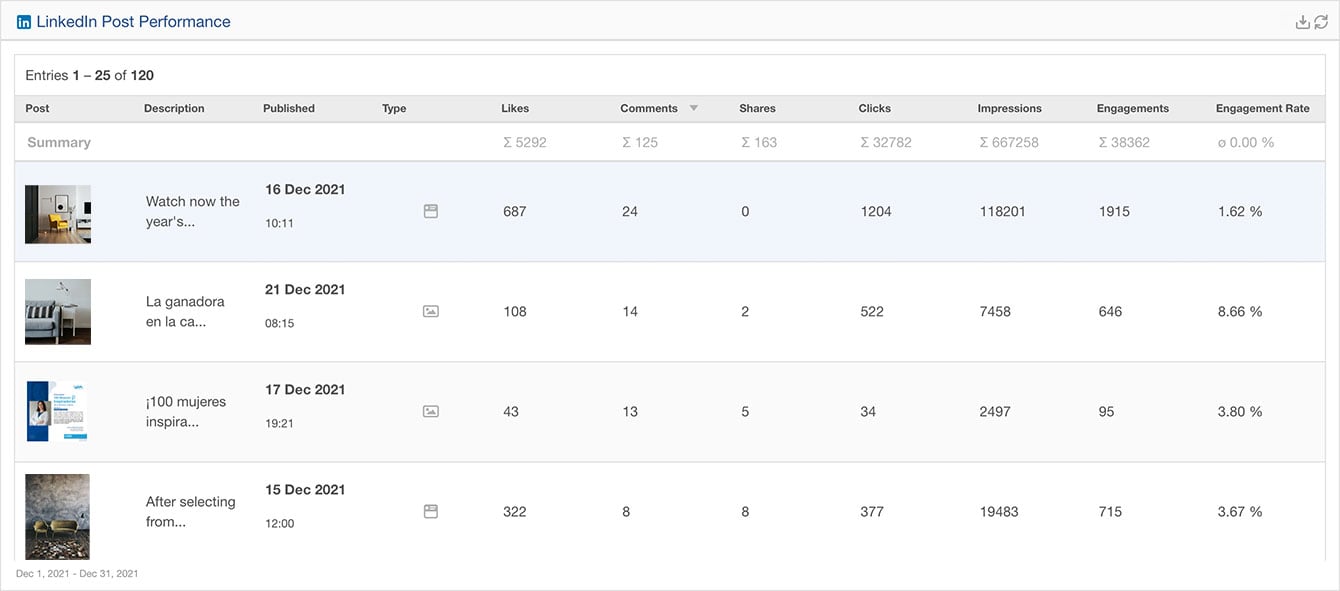
You can now analyze your social media activity at all levels, as the LinkedIn Post Performance Widget shows you how well your posts are performing and is now available for dashboard and reporting. Use these analytics to adjust your content creation strategy and attract or increase the attention of your target audience.

In the table you can see directly what kind of post it is and when you published it. You also get more insights with the following KPIs:
-
Likes: Sum of the reactions/likes of your post
-
Comments: Number of comments under your post
-
Shares: Number of shared posts
-
Clicks: Number of clicks on your content, company name or logo by a (registered) member. Interactions (shares, reactions and comments) are not included.
-
Impressions: How many times was your post viewed? Number of times your post was viewed on one screen (at least three seconds)
-
Engagements: Sum of interactions (likes, comments, shares, clicks)
-
Engagement Rate: The engagement rate shows the number of interactions and the number of clicks and followers reached, divided by the number of impressions.
In addition, the tags help you to structure your posts in the Publisher and then evaluate them in the Post Performance. To do this, simply select one or more tags in the dropdown by which you want to filter the results. Learn more about tags in Facelift Cloud here.
If you are unsure which widgets are useful for your LinkedIn analysis, try our dashboard templates. After selecting your desired profile, you will see all available KPIs as well as useful charts, which you can of course customize to your needs via the widget settings.
We have also documented the details of all LinkedIn widgets for you in our Knowledge Base.
We wish you a lot of fun and successful analysis of your LinkedIn profiles!
Tom
Product Marketing Manager


